Fundamental vs Technical Analysis: What's the Difference?
A balanced, in-depth evaluation comparing financial statement valuation with price action chart analysis to help you formulate a coherent market strategy.
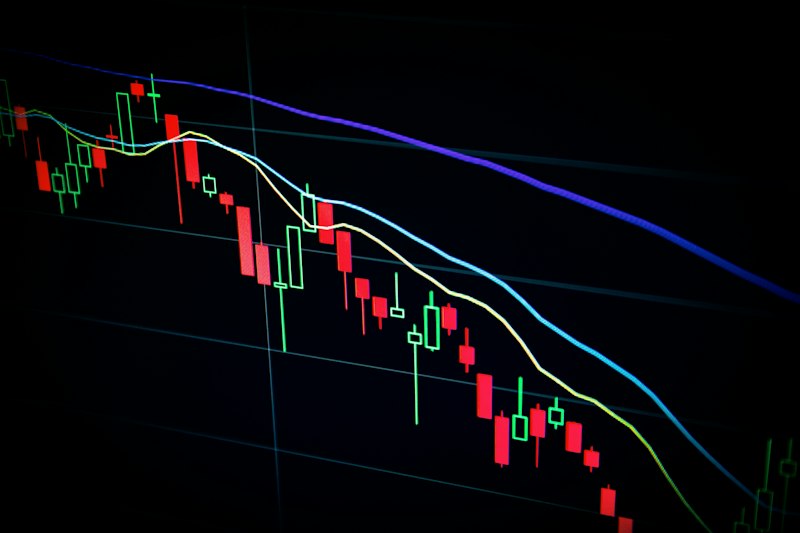
Side-by-side comparison of corporate financial balance sheets and candlestick technical chart analysis • Editorial Photography & Analysis
Key Takeaways
Fundamental analysis evaluates a business's intrinsic worth by scrutinizing financial statements, competitive moats, and macroeconomic conditions.
Technical analysis examines historical price action, trading volumes, and chart patterns to forecast short-term supply and demand imbalances.
Long-term value investors rely on fundamentals to determine WHAT company to buy, while institutional desks often use technicals to optimize WHEN to buy.
Pure technical day trading carries steep failure rates compared to long-term valuation-driven compounding.
In capital markets, few debates ignite as much passion as the contest between Fundamental Analysis and Technical Analysis.
Fundamental analysts view stocks as fractional business partnerships; they spend weekends dissecting balance sheets, profit-and-loss statements, and management track records. Technical analysts, by contrast, view price charts as the ultimate aggregator of all market information; they analyze candlestick patterns, moving averages, and volume breakouts.
To navigate the markets effectively, you must understand the strengths, limitations, and operational purposes of both methodologies.
Fundamental Analysis: The Search for Intrinsic Value
Fundamental analysis operates on a core premise: a stock has an intrinsic economic value independent of its current quoted market price.
If the market price trades significantly below that intrinsic valuation, a “Margin of Safety” exists, presenting an attractive buying opportunity.
Core Metrics in Fundamental Valuation
Price-to-Earnings (P/E) Ratio: Compares share price to trailing earnings per share (EPS). Helps determine if a stock is expensive relative to its sector peers.
Price-to-Book (P/B) Ratio: Compares market capitalization to net asset book value.
Return on Equity (ROE) & Return on Capital Employed (ROCE): Measures management efficiency at compounding shareholder capital. High, consistent ROE (>15%) indicates a durable economic moat.
Free Cash Flow (FCF): Cash generated by operations minus capital expenditures. Cash flow cannot be easily manipulated by accounting gimmicks.
Debt-to-Equity Ratio: Audits balance sheet leverage and solvency risks during economic recessions.
Technical Analysis: The Study of Market Psychology
Technical analysis assumes that all publicly known information—earnings, competitive threats, rumors, and macroeconomic data—is already priced into the stock chart.
Rather than forecasting where the business will be in ten years, technical traders study price action to determine the balance of power between buyers (bulls) and sellers (bears) right now.
Core Tools in Technical Analysis
Support & Resistance Levels: Horizontal price floors where buying demand historically halts declines, and price ceilings where selling pressure halts rallies.
Moving Averages (50-Day, 200-Day SMA): Trend-following indicators that smooth out daily price noise to reveal broad directional momentum.
Relative Strength Index (RSI): A momentum oscillator ranging from 0 to 100 identifying temporary “overbought” (>70) or “oversold” (<30) conditions.
Volume Confirmation: Spikes in trading volume validating the strength of a price breakout.
Head-to-Head Comparison
Analytical Dimension
Fundamental Analysis
Technical Analysis
Primary Goal
Determine intrinsic business value and financial durability.
Predict short-to-medium term price trajectory and timing.
Primary Data Source
10-K/10-Q reports, cash flow statements, industry competitive moats.
Long-term wealth builders, pension funds, value investors.
Day traders, swing traders, tactical portfolio rebalancers.
Primary Limitation
A fundamentally undervalued stock can remain depressed for years.
Susceptible to false chart breakouts and high transaction fee drag.
Methodology Evaluation
Fundamental vs Technical Verdict
9.5HIGH VALUE
For long-term retail wealth creation, fundamental analysis is vastly superior. Understanding corporate balance sheets protects you from catastrophic bankruptcies. However, combining both disciplines—using fundamental analysis to select high-quality companies, and basic technical analysis (such as major moving averages) to identify favorable entry prices—provides an ideal pragmatic synergy.
Key Advantages
✓Fundamental analysis anchors investor psychology during broad market downturns
✓Technical analysis enforces disciplined stop-loss risk management for active participants
✓Combining both methods prevents buying overextended cyclical peaks
Key Limitations
✕Deep fundamental analysis requires accounting literacy and extensive research hours
✕Pure technical trading incurs high short-term capital gains taxes and broker slippage
Evaluation Criteria Breakdown
Long-term Reliability9.8 / 10
Risk Management Utility9.2 / 10
Ease of Execution8.5 / 10
Summary Specifications & Parameters
Ideal Fundamental Horizon
3+ Years Holding Period
Ideal Technical Horizon
Swing Trades (Days to Weeks)
Recommended Hybrid Strategy
Techno-Funda: Quality Business at Chart Support
Frequently Asked Questions
Can you be successful using only technical analysis?
A tiny minority of disciplined quantitative and swing traders succeed with pure technicals. However, academic research consistently demonstrates that over 90% of retail day traders reliant purely on chart patterns underperform broad-market buy-and-hold index portfolios after accounting for trading fees and taxes.
Where can I find free financial statement data for fundamental analysis?
Public company filings are accessible directly via regulatory databases (SEC EDGAR in the US, BSE/NSE in India). Excellent free financial aggregators include Yahoo Finance, Macrotrends, Screener.in, and Morningstar.
Can an investor successfully combine both fundamental and technical analysis?
Yes, this hybrid approach is widely practiced by institutional portfolio managers. Fundamental analysis is used to determine *what* high-quality businesses to own based on earnings and balance sheets, while technical analysis helps identify *when* to enter or exit positions based on price support and momentum.
What are the core financial statements evaluated in fundamental analysis?
Fundamental analysts scrutinize three key regulatory reports: the Balance Sheet (assets, liabilities, and shareholder equity), the Income Statement (revenue, gross margins, and net income), and the Cash Flow Statement (operating cash flow, capital expenditures, and free cash generation).
What are moving averages in technical analysis and how are they used?
Moving averages (such as the 50-day and 200-day simple moving averages) smooth out short-term price fluctuations to reveal the prevailing underlying trend. A 'Golden Cross' occurs when a short-term average crosses above a long-term average, signaling bullish market momentum.
Editorial & Regulatory Disclaimer: This article is published exclusively for educational and informational purposes. Income Innovate does not offer individualized investment, legal, tax, or banking advice. Market investments and credit instruments carry inherent financial risk. Review official statutory guidelines before making commitments.
Shivam covers stock markets, financial systems, loans, credit, business finance, taxation, economic developments, and the changing financial landscape. His writing focuses on explaining important financial concepts through clear examples and structured analysis.
Master the essential vocabulary of Wall Street: market capitalization, P/E ratios, bull vs bear markets, liquidity, volatility, and order execution terminology.